Top 7 Mobile App Data Analysis Tools for 2023. How to Choose the Right Tool?
Contents
Help organizations and individuals understand and leverage information from data to make informed decisions, improve performance, and drive progress in various fields. This is of significant importance in ensuring success and competitiveness in today’s business and societal environments.
To choose which tool is right for your business? Following this article below.
Why is mobile app analytics important?
Mobile app data analytics refers to the collection, measurement, analysis, and interpretation of data related to the usage and performance of a mobile application. These data analysis tools are used by app developers, marketers, and product managers to gain insights into how their mobile apps are performing and how users are interacting with them.

Mobile app data analytics is important if you want to understand how well your app is meeting users’ needs, and what improvements you might need to make. Now, let’s take a look at some of the benefits of integrating data analytics tools into your mobile app development process.
User Behavior Understanding
Mobile app analytics helps you gain insights into how users interact with your app. It allows you to track user behavior, such as which features they use the most, how long they spend in the app, and what actions they take. Understanding user behavior is crucial for optimizing the user experience and increasing engagement.
Performance Monitoring
Data analytics tools provide information on the performance of your mobile app, including app crashes, errors, and load times. Monitoring performance helps you identify and fix issues quickly, ensuring a smooth and reliable user experience.
User Acquisition and Retention
Mobile app data analytics tools can help you track user acquisition channels, such as organic searches, paid advertising, or referrals. This data allows you to allocate resources effectively and focus on the most successful acquisition channels. Additionally, analytics can help you identify user drop-off points and optimize your app to improve user retention rates.
Product Development
Insights from mobile app analytics can inform your product development roadmap. By understanding which features are popular and which ones need improvement, you can prioritize development efforts and deliver a better app over time.
Data-Driven Decision Making
Ultimately, mobile app analytics empowers you to make data-driven decisions rather than relying on gut feelings or intuition. This can lead to more informed choices, better user experiences, and improved business outcomes.
The 7 best data analysis tools for mobile apps in 2023
Which data analysis tools do marketers trust and choose to help measure, analyze, and evaluate data analysis on mobile apps? Let’s find out below!
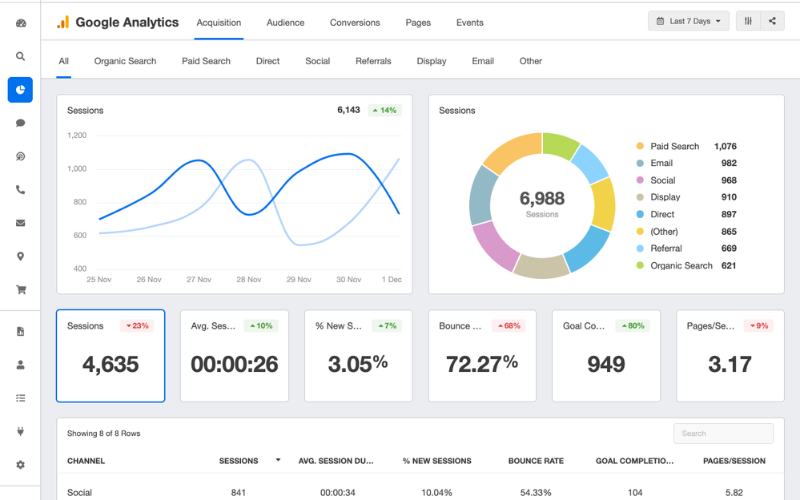
Google Analytics
Google Analytics is a comprehensive mobile app data analytics tool offered by Google. It is specifically designed to help mobile app developers and marketers track and analyze user behavior, app performance, and user engagement across various mobile platforms, including iOS and Android.
Some key features of Google Analytics data analysis tool include:
- Event Tracking to measure specific actions that are important to your app’s goals
- Funnel Analysis allows you to create funnels to track user journeys and analyze the steps users take to complete specific actions or conversions within your app. This helps identify drop-off points and areas for improvement.
- Real-Time Analytics helps you monitor the immediate impact of changes or marketing campaigns.
- Cloud Messaging ·provides a reliable and battery-efficient connection between servers and devices. It allows you to send/receive messages and receive notifications on iOS, Android and web for free.
Mixpanel
Mixpanel is a widespread product analytics and user engagement platform that offers a range of features to help businesses track, analyze, and optimize user Firstly, you should understand the importance of mobile app analytics. And how interactions and behaviors. Here are some key features of Mixpanel:
- Event Tracking and Analysis: Mixpanel allows you to track and analyze user interactions and events within your website or mobile app. And it helps following the event to be granular, providing insights into how users engage with your product. Also, it helps you identify trends, bottlenecks, and opportunities for improvement, which Mixpanel is better than Google Analytics.
- Mobile and Web : Mixpanel supports tracking for both web and mobile applications, allowing you to gather insights from various platforms.
- A/B Testing and Experimentation: Mixpanel supports A/B testing and split testing, allowing you to experiment with different variations of your website or mobile app to determine which changes are most effective in achieving your goals.
- Notifications and Messaging: Mixpanel includes messaging features that enable you to send targeted push notifications, in-app messages, and emails to engage users and encourage specific actions or behaviors.
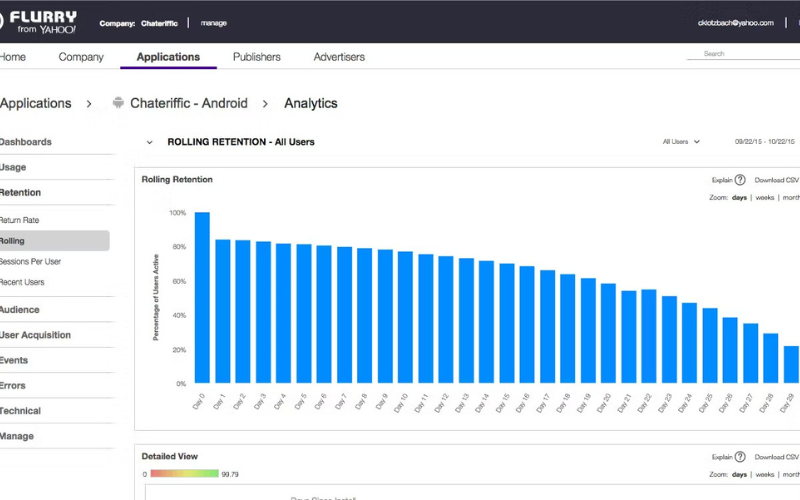
Flurry Analytics
, Flurry Analytics offered by Yahoo (now part of Verizon Media Group), is a data analytics platform that provides valuable insights into user behavior, app performance, and advertising campaigns.
Here are some outstanding features of Flurry:
- Event Tracking and Analysis: Flurry allows you to monitor actions such as button clicks, screen views, in-app purchases, and any custom events that are specific to your app’s goals and functionality.
- User Attribution: You can determine how users found and installed your app, whether through organic search, paid advertising, referrals, or other channels. This helps you understand user acquisition sources and optimize marketing efforts.
- User Segmentation: Flurry provides the capability to segment your user base based on various criteria, including demographics, user attributes, behavior, or user cohorts. This segmentation enables targeted messaging and personalized user experiences.
- Funnel Analysis: You can create funnels to track user journeys and analyze conversion rates at each step. This helps identify drop-off points and areas for improvement in the user experience.
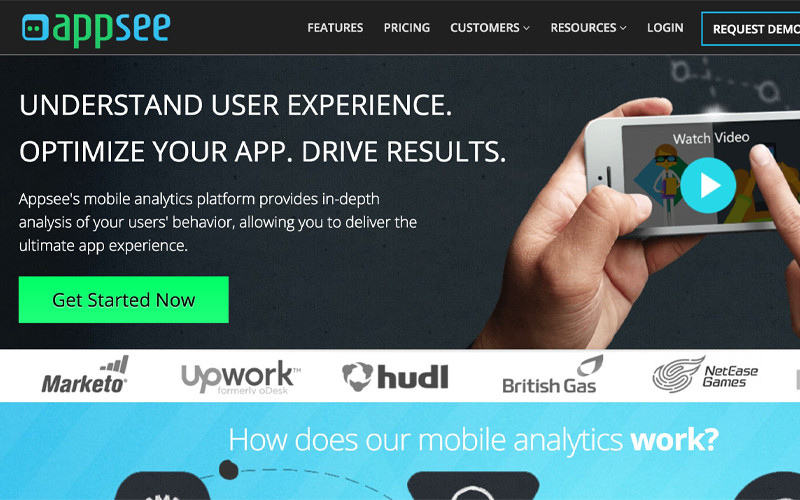
Appsee
Appsee is a mobile app analytics and user experience platform. Appsee’s outstanding analytics tools include:
- Session Recordings: Appsee allows you to record user sessions within your mobile app, providing a visual representation of how users navigate through the app. This could help you identify issues, user engagement patterns, and areas for improvement
- Touch Heatmaps: Appsee generates heatmaps to show where users tapped, swiped, and interacted the most within your app’s interface. They aggregate all the collected data about how users interact with the app and highlight the areas of the screen where the most and the least gestures take place. This could help you understand which elements were most engaging and which might need design changes.
- Conversion Funnels: You could set up conversion funnels to track user journeys through specific app processes and identify where users drop off or successfully complete actions. This data was valuable for improving conversion rates.
These features give mobile teams the insights they need to create winning UX, boost retention, and increase conversion rates.
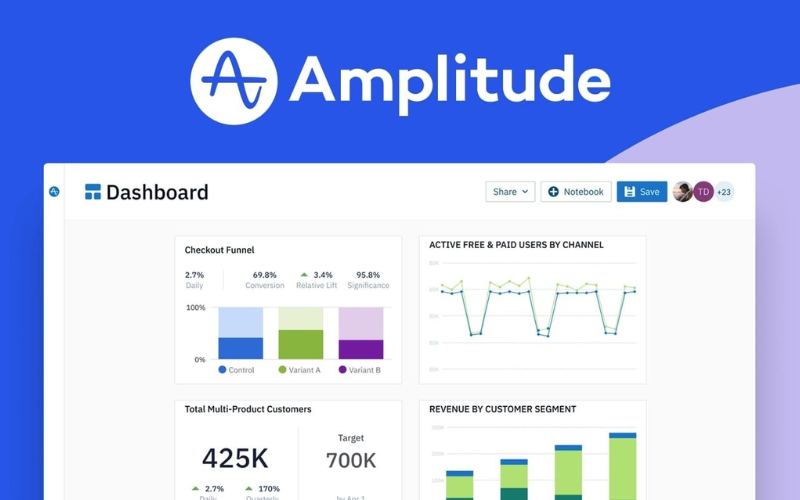
Amplitude
Amplitude is a product analytics platform that enables you to build better products by tracking and understanding user behavior. This tool is very suitable for Product Managers who want to retain customers with their business’s products and services. Here are some key features of the tool:
- Event Tracking: Amplitude enables you to track user data and gain insights into user engagement, classify customers, support analysis of channels, revenue, customer retention rate, etc.
- Data Security: Amplitude keeps your data trustworthy and secure, ensuring that you have access to accurate and reliable information.
- Event Properties: Amplitude offers powerful analytics tools that help answer questions about what happened, why it happened, and which actions to take next.
- Smoothly Share: With this tool, you can seamlessly share your work across teams, facilitating collaboration and driving growth.
Amplitude is a completely free website analysis tool. If you want to experience what a data analysis tool is like or you’re not ready to invest in website analysis, this is a perfect free tool that optimally meets your needs.
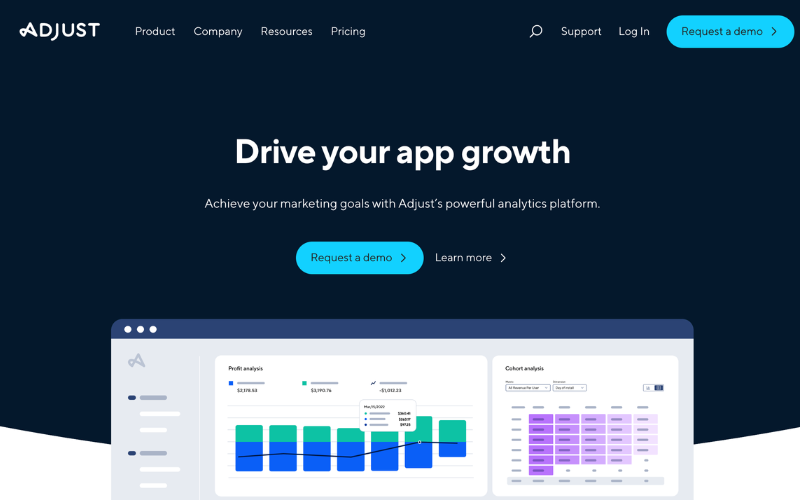
Adjust
Adjust is an outstanding tool for app event tracking that can be used for both app analytics and attribution platforms. Here are some highlights of tool:
- Data Security: Adjust is one of the best MMPs trusted by major companies such as Spotify, Zynga, Rovio because of its high security and data security policy that is always top priority.
- Comprehensive tool: This is a tool used for attribution, application analysis, data storage, campaign measurement, cohort analysis,…and supports many digital channels.
Adjust uses private cloud infrastructure, instead of a third-party solution (Appsflyer uses AWS), so in terms of security, this company is unmatched. It is especially useful for projects that want to test tracking and don’t want to sign an annual contract.
Kochava
Kochava provides a comprehensive and objective analytics platform, helping companies in all stages of their work: from research to campaign optimization.
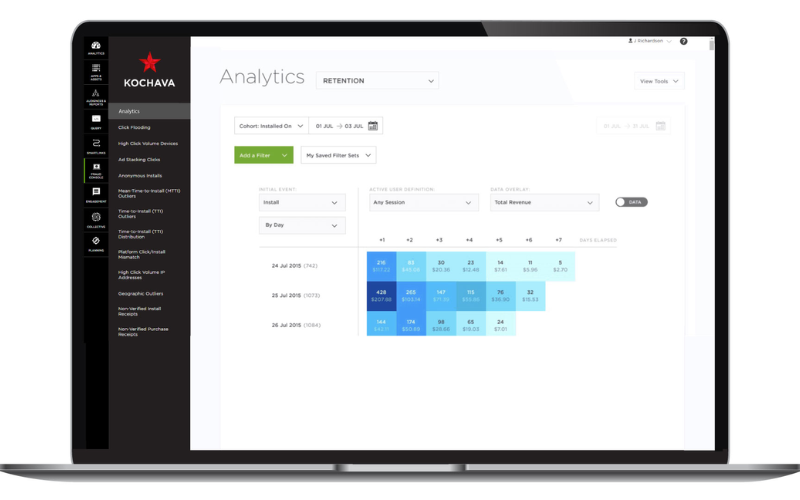
Some features of the Kochava data analysis tool:
- Kochava allows data integration with a wide selection of third-party tools
- Kochava offers the full version for free if you agree to share your data. This solution is quite suitable for an indie developer, not suitable for large organizations.
Raw data is available for free trial. This solution has an attractive pric and many integrated solutions, which is useful for small and companies just starting to build and develop
Tips for using mobile app data analysis tools
Set clear goals
Firstly, you should identify your overall business objectives. From there, visualize what needs to be done and establish the steps.

Next, translate your broader business objectives into specific goals for your mobile app. Consider how your app can contribute to achieving those objectives. For example, if your business objective is to increase revenue, your app goal might be to boost in-app purchases or subscriptions.
Then, continuously monitor progress toward your goals using your mobile app data analysis tools. Regularly review the data to see if you are on track. If not, be prepared to adjust your strategies as needed.
Goals and strategies may need to be refined based on ongoing analysis and feedback. Be ready to iterate and refine your goals as you gain more insights from your data.
Choose the right metrics
Choosing the right metrics for mobile app data analysis is critical for gaining meaningful insights and making informed decisions. The choice of metrics should align with your app’s goals and objectives.
For each business goal, define specific metrics that directly measure progress toward that goal. Be as specific and quantifiable as possible. Above all, you should choose important metrics to measure work performance. Be cautious of vanity metrics that may look impressive but do not provide meaningful insight..
Visualize your data
Visualizing data is a crucial step in data analysis as it helps you understand trends, patterns, and insights more effectively.
Here are some tips for visualizing data in mobile app data analysis tools:
Select the Right Visualization Type: Choose the appropriate chart or visualization type based on the nature of your data and the insights you want to convey. Common visualization types include line charts, bar charts, pie charts, scatter plots, heat maps, and more.
Organize and Clean Data: Ensure that your data is well-organized and clean before creating visualizations. Remove any duplicates, outliers, or missing values that could distort your visualizations.
Define Your Key Metrics: Identify the key metrics and KPIs that you want to visualize. These metrics should align with your app’s goals and objectives.
Use Dashboards: Consider creating interactive dashboards that allow you to display multiple visualizations and metrics on a single screen. Dashboards provide a holistic view of your app’s performance.
Remember that effective data visualization not only communicates insights but also tells a compelling story about your mobile app’s performance. Tailor your visualizations to your audience and objectives, and regularly refine them to maximize their impact on decision-making.
Act on your insights

Having planned with information from data analysis tools, you should turn your data into actions. It is important that you test your application on many different devices. From there, observe and consider the situation, what problems need to be improved, and find appropriate solutions to your issues. Thoroughly test and ensure that application performance aligns with your initial goals.
Data Analytics Service
Rikkeisoft is one of the top 5 enterprise software development companies, achieving many prestigious awards and certifications. We have accumulated many years of experience in the data and have a highly specialized team.
Rikkeisoft’s data analytics service equips organizations with the tools and knowledge to extract valuable insights from their data. This helps them to succeed in today’s data-centric business environment, facilitating data-driven decision-making, innovation, and overall excellence.
Conclusion
By following these tips and using mobile app data analysis tools effectively, you can gain valuable insights, improve user experiences, and make informed decisions to grow and enhance your mobile app.

More From Blog

March 13, 2026
BFSI: Modernizing Core Banking Systems Without Disrupting Operations
Digital banking appears sophisticated on the surface. Customers transfer money in seconds, open accounts remotely, and receive real-time notifications. Yet beneath these seamless experiences, many banks still operate on infrastructure designed decades ago. According to Boston Consulting Group’s June 2025 report, between 90 and 95 percent of banks in the Southeast Asia region still operate […]

October 28, 2025
Australia’s Fintech Revolution: Trends Shaping the Future of Digital Finance
Australia has emerged as one of the most dynamic fintech hubs in the Asia-Pacific region, driven by strong consumer demand for digital financial services, supportive government regulations, and the widespread adoption of innovative technologies. As the industry matures, the imperative for digital transformation has become unmistakable: fintechs and financial institutions alike are under pressure to […]

August 12, 2025
AI and Big Data in Building Smart Insurance Platforms
The insurance industry is now standing at a pivotal moment in its digital evolution. Traditional insurance models built on historical data analysis and reactive risk assessment are rapidly giving way to intelligent, predictive platforms powered by artificial intelligence and big data analytics. This transformation represents more than technological modernization; it’s a fundamental reimagining of how […]

July 23, 2025
Insurtech’s Game-Changing Trends: How AI and Digital Transformation Are Reshaping Insurance
The financial technology sector is experiencing unprecedented change, making it essential for business leaders and technology professionals to stay ahead of emerging innovations. Throughout 2025, insurance technology (insurtech) has emerged as a powerful catalyst for change, fundamentally altering how insurance providers conduct business, engage with clients, and assess risks. This technological evolution represents more than […]
April 4, 2024
Big Data Performance: Maximize Your Business Value
In today’s data-driven world, organizations are constantly generating and collecting immense amounts of data to understand their customers more deeply. This data, often referred to as “big data,” holds immense potential for organizations to seek opportunities and overcome challenges. But accessing and analyzing big data isn’t enough to have proper strategies; organizations must pay attention to […]

April 4, 2024
How Real-Time Data Analysis Empowers Your Business
In today’s fast-paced business landscape, the ability to quickly make data-driven decisions has become a key differentiator for success. Real-time data analysis, the process of analyzing data as soon as it’s generated, has emerged as a powerful tool to empower business across industries. By leveraging real-time data analysis, organizations can gain timely and actionable insights, […]