Introduction to Data Visualization and Key Considerations for Businesses
Contents
In your opinion, what is data visualization? Your main goal is to communicate your recommendations engagingly and effectively, right? To achieve this, let’s immediately explore a method that can represent information with images.
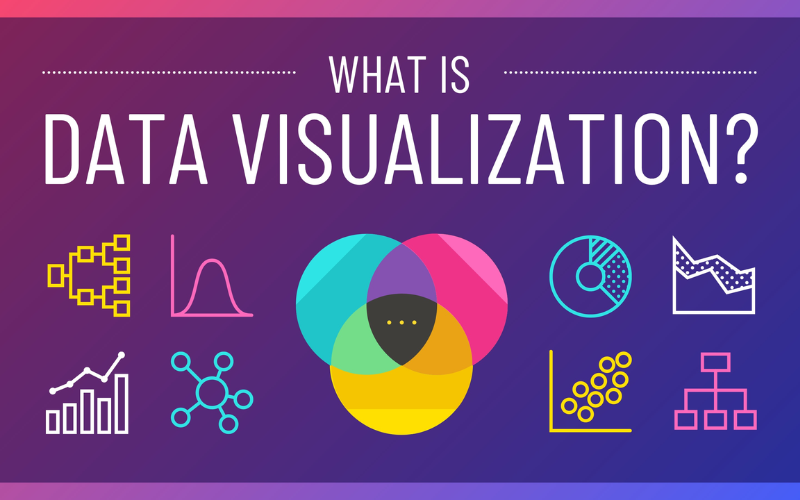
What is Data Visualization?
Define data visualization and their roles in organizations
First, you need to find the answer to the question: What is Data Visualization? Data visualization is the graphical representation of data to help people understand the patterns, trends, and insights within the data. It transforms raw data into a visual format (e.g. chart, infographic, diagram or map…), making it easier to identify patterns, correlations, and outliers. In the business context, effective data visualization is crucial for decision-making, as it allows stakeholders to quickly grasp complex information and make informed choices.
What is Data Visualization’s role in businesses? Here are some roles of data visualization in businesses:
- Decision Support: Data visualization play a crucial role in supporting decision-making processes. By presenting information visually, decision-makers can quickly understand key trends and factors influencing their decisions.
- Insight Discovery: Visualization helps in uncovering insights and patterns within data that might be difficult to discern in raw formats. This is particularly important for identifying opportunities, mitigating risks, and optimizing processes.
- Communication: Visualizations serve as powerful tools for communicating complex data to a broad audience. Whether presenting findings to executives, stakeholders, or the general public, visualizations (e.g. colour, illustration, design, shape…) make information more accessible and engaging.
- Performance Monitoring: Organizations use visualizations to monitor key performance indicators (KPIs) and track progress toward goals. This real-time tracking helps in assessing the effectiveness of strategies and initiatives.
Discuss the skills and responsibilities required for data visualization professionals
Skills Required for Data Visualization Professionals
- Data Analysis: Proficiency in data analysis is fundamental. Data visualization professionals need to understand the data they are working with, identify patterns, and draw meaningful insights.
- Visualization Tools: Mastery of data visualization tools such as Tableau, Power BI, D3.js, or others is crucial. These tools enable professionals to create effective and visually appealing representations of data.
- Programming Skills: Knowledge of programming languages like Python, R, or JavaScript is valuable. This is especially important for customizing visualizations, handling large datasets, and integrating with other data analysis tools.
- Statistical Knowledge: Understanding statistical concepts is essential for accurate data interpretation and visualization. It includes knowledge of probability, hypothesis testing, and regression analysis.
- Design Principles: A grasp of design principles is necessary for creating visually appealing and effective visualizations. This includes knowledge of color theory, typography, layout, and other design fundamentals.

Responsibilities of Data Visualization Professionals
- Data Exploration: Explore datasets to understand the characteristics of the data, identify trends, and gain insights that can be effectively visualized.
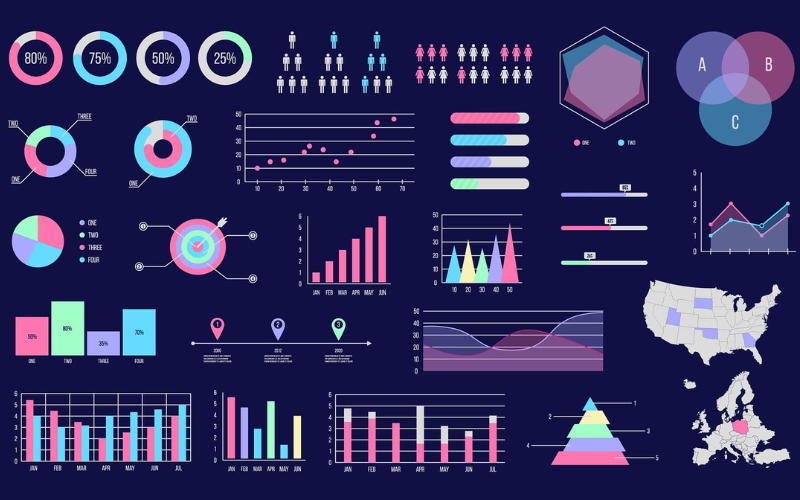
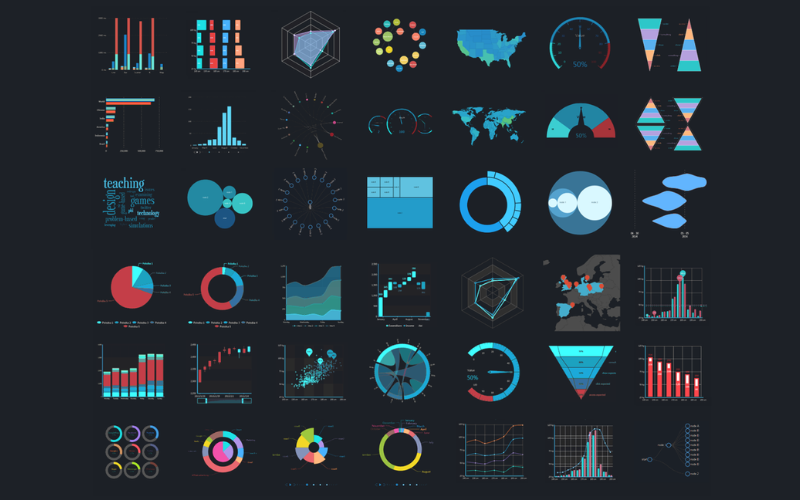
- Visualization Development: Create a variety of visualizations based on the specific needs and objectives of the organization. This includes choosing appropriate chart types and visualization methods.
- User Interaction: Develop interactive features that enhance user engagement and allow for deeper exploration of the data. This may involve incorporating filters, tooltips, and drill-down options.
- Collaboration: Collaborate with data scientists, analysts, and business stakeholders to understand requirements, provide insights, and refine visualizations based on feedback.
- Data Storytelling: Structure visualizations in a way that tells a cohesive and compelling data story. This involves presenting insights in a logical sequence to convey a clear narrative as well as using icons or bold fonts to highlight essential statistics and information.
Highlight the diversity of data visualization titles
The field of data visualization is diverse, with professionals assuming various roles that cater to different aspects of the data visualization process. Below are a few popular titles related to the field of data visualization that you should know:
1. Information Designer
2. Data Visualization Analyst
3. Data Visualization Specialist
4. Data Visualization Architect
5. Data Visualization Developer
6. Interactive Data Visualization Designer
7. Visual Data Scientist
8. Data Visualization Strategist
9. Dashboard Designer
10. Infographic Designer
11. Geospatial Data Visualization Specialist
12. Business Intelligence Visualizer
13. Data Storyteller
14. Data Artist
15. Data Presentation Designer
These titles reflect the diverse skill sets, expertise, and focus areas that professionals in the data visualization field may have. Some roles may be more focused on design and aesthetics, while others may involve technical implementation, analysis, or strategic decision-making. It’s important to note that the specific titles and responsibilities can vary across organizations and industries, as the field of data visualization continues to evolve and adapt to the needs of businesses and data-driven decision-making.
The Value of Data Visualization
Explore the importance of data visualization in conveying complex data insights
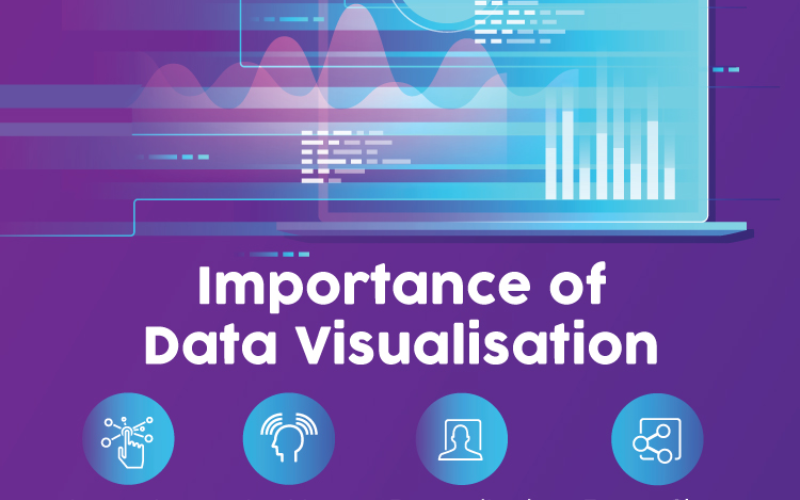
Humans are highly visual beings, and we process visual information more efficiently than text or raw data. Visualization transforms complex datasets into graphical representations, making it easier for individuals to grasp patterns, trends, and relationships.
In essence, what is data visualization? It is a powerful tool that bridges the gap between data and understanding. It turns raw data into actionable insights, promotes informed decision-making, and serves as a universal language that transcends disciplinary boundaries within organizations. As the volume and complexity of data continue to grow, the importance of effective data visualization becomes even more pronounced in facilitating meaningful and impactful insights.
Explain how it aids in decision-making, storytelling, and identifying trends
1. Decision-Making
Data visualization simplifies complex information, enabling decision-makers to quickly grasp key insights. Visual representations such as charts and graphs make it easier to identify trends, patterns, and outliers, allowing for more informed and timely decisions.
Visualizations facilitate the comparison of different data points and the understanding of relationships between variables. This aids decision-makers in evaluating options, assessing risks, and choosing the most effective course of action.
Interactive visualizations empower decision-makers to explore data in real-time. Features like filters and drill-down options allow for a more detailed analysis, enabling decision-makers to dig deeper into specific aspects of the data relevant to their decision.
2. Storytelling
Visualizations can be structured in a narrative format to tell a story. By guiding the audience through a logical sequence of visualizations, data storytellers can present complex information in a way that is engaging, coherent, and easy to follow.
Well-crafted visualizations evoke emotions and make the data more relatable. This emotional connection enhances the impact of the storytelling, helping the audience to connect with the data and understand its implications on a deeper level.
Data visualizations provide context to the data, helping to frame the story in a meaningful way. The ability to highlight specific data points and trends reinforces the narrative, ensuring that the audience focuses on the most crucial aspects of the information being presented.
3. Identifying Trends
Visualizations are excellent tools for pattern recognition. By representing data graphically, trends and patterns become more apparent, making it easier to identify and understand long-term developments or recurring cycles.
Visualizations help in spotting anomalies or outliers in the data that might indicate irregularities or unexpected events. This is crucial for identifying issues that require attention or further investigation.
Time-series visualizations, such as line charts or heatmaps, enable the identification of temporal trends. This is especially valuable for understanding how variables change over time and making predictions based on historical patterns.
Share examples of industries and scenarios where data visualization is crucial
Here are examples of industries where data visualization plays a critical role:
Finance
Scenario: Analyzing market trends, tracking investment portfolios, and visualizing financial performance.
Examples: Stock price charts, portfolio dashboards, financial reports.
Healthcare
Scenario: Understanding patient data, tracking disease outbreaks, and monitoring healthcare performance metrics.
Examples: Electronic health record (EHR) visualizations, disease spread maps, patient outcome dashboards.
Marketing
Scenario: Analyzing customer behavior, tracking campaign performance, and visualizing market trends.
Examples: Customer journey maps, social media analytics dashboards, marketing funnel visualizations.
Retail
Scenario: Optimizing inventory management, analyzing sales data, and understanding customer buying patterns.
Examples: Sales performance dashboards, inventory turnover visualizations, customer segmentation charts.
Manufacturing
Scenario: Monitoring production processes, optimizing supply chain management, and analyzing equipment performance.
Examples: Supply chain flowcharts, production efficiency dashboards, and equipment downtime visualizations.
These examples illustrate that data visualization is ubiquitous across industries, providing insights that are crucial for making strategic decisions, optimizing operations, and understanding complex relationships within diverse datasets. The versatility of data visualization makes it an essential tool for professionals in various roles and industries.
Collaborative Skills
Discuss the collaborative nature of data visualization roles and the need to work closely with data analysts and domain experts
The collaborative nature of data visualization roles is evident in the close working relationships with data analysts and domain experts. This collaboration is vital for creating visualizations that are not only visually appealing but also accurately represent the insights derived from data analysis and domain-specific knowledge. Successful collaboration enhances the overall impact of data-driven insights within an organization. Here are some benefits of this collaboration:
- Understanding Data Requirements: Data visualization professionals need to work closely with data analysts to understand the goals and objectives of data analysis. By collaborating from the outset, visualization specialists can tailor their work to meet the specific needs of the analysis.
- Translating Data into Visual Narratives: Data analysts possess in-depth knowledge of the data, its context, and the analytical methods used. Data visualization professionals collaborate with analysts to translate these insights into visual narratives that can be easily understood by a broader audience, including non-technical stakeholders.
- Domain Expertise Integration: In many cases, data visualization projects require input from domain experts who possess specialized knowledge related to the industry or subject matter. Collaborating with domain experts helps ensure that visualizations accurately reflect the intricacies of the field, making them more meaningful and actionable.
- Effective Communication: Data visualization professionals act as intermediaries between data analysts, domain experts, and other stakeholders. Their ability to communicate effectively, bridging the gap between technical and non-technical audiences, is crucial for the success of the collaborative process.
- Tailoring Visualizations to Stakeholder Needs: Collaboration extends to understanding the perspectives and requirements of diverse stakeholders. Data visualization specialists collaborate with analysts and domain experts to create visualizations that cater to the specific needs and preferences of different audience segments.

Stress the importance of effective communication and teamwork
Effective communication and teamwork are foundational to the success of any group or organization. They facilitate collaboration, productivity, decision-making, conflict resolution, trust-building, knowledge sharing, and employee engagement. Investing in developing strong communication skills and fostering a culture of teamwork can lead to improved performance, innovation, and a positive work environment.

More From Blog

March 13, 2026
BFSI: Modernizing Core Banking Systems Without Disrupting Operations
Digital banking appears sophisticated on the surface. Customers transfer money in seconds, open accounts remotely, and receive real-time notifications. Yet beneath these seamless experiences, many banks still operate on infrastructure designed decades ago. According to Boston Consulting Group’s June 2025 report, between 90 and 95 percent of banks in the Southeast Asia region still operate […]

October 28, 2025
Australia’s Fintech Revolution: Trends Shaping the Future of Digital Finance
Australia has emerged as one of the most dynamic fintech hubs in the Asia-Pacific region, driven by strong consumer demand for digital financial services, supportive government regulations, and the widespread adoption of innovative technologies. As the industry matures, the imperative for digital transformation has become unmistakable: fintechs and financial institutions alike are under pressure to […]

August 12, 2025
AI and Big Data in Building Smart Insurance Platforms
The insurance industry is now standing at a pivotal moment in its digital evolution. Traditional insurance models built on historical data analysis and reactive risk assessment are rapidly giving way to intelligent, predictive platforms powered by artificial intelligence and big data analytics. This transformation represents more than technological modernization; it’s a fundamental reimagining of how […]

July 23, 2025
Insurtech’s Game-Changing Trends: How AI and Digital Transformation Are Reshaping Insurance
The financial technology sector is experiencing unprecedented change, making it essential for business leaders and technology professionals to stay ahead of emerging innovations. Throughout 2025, insurance technology (insurtech) has emerged as a powerful catalyst for change, fundamentally altering how insurance providers conduct business, engage with clients, and assess risks. This technological evolution represents more than […]

April 4, 2024
Big Data Performance: Maximize Your Business Value
In today’s data-driven world, organizations are constantly generating and collecting immense amounts of data to understand their customers more deeply. This data, often referred to as “big data,” holds immense potential for organizations to seek opportunities and overcome challenges. But accessing and analyzing big data isn’t enough to have proper strategies; organizations must pay attention to […]

April 4, 2024
How Real-Time Data Analysis Empowers Your Business
In today’s fast-paced business landscape, the ability to quickly make data-driven decisions has become a key differentiator for success. Real-time data analysis, the process of analyzing data as soon as it’s generated, has emerged as a powerful tool to empower business across industries. By leveraging real-time data analysis, organizations can gain timely and actionable insights, […]