Data-Driven Decision Making: How It Benefits Your Business
Contents
Data-driven decision making (DDDM) is a widely used approach in many fields of the industry. This process grants businesses the power to gain real-life insights based on accurate and relevant data, ultimately making informed decisions. The following article will shed light on DDDM so that your business can better benefit from it.
What Is Data-Driven Decision Making?
The data-driven decision making process entails analyzing relevant data, such as metrics and facts, to make informed decisions aligned with your business’s goals. Real-time data is collected from market research and undergoes thorough verification and analysis.
This way, businesses can have a better understanding of market trends, customer intent, and more, enabling them to make strategic decisions based on these insights. DDDM ensures transparency and consistency, as well as reduces risks through the decision making process. Gone are the days of planning strategies based on assumptions; now is the time for more data-based solutions.

Data-driven decision making process helps businesses make informed decisions – Source: Pxhere
How Can Data-Driven Decision Making Benefit Organizations?
Becoming More Confident In Decision Making
As mentioned, eliminating guesswork and assumptions allows your business to make decisions more confidently, whether it’s launching new products, expanding your market, adjusting your marketing plan, and so forth.
Real-time and accurate data provide a solid foundation for you to understand the current market dynamics and assess the impact of your decisions on your business, allowing you to make necessary adjustments. There is no room for subjective elements like intuition or gut instinct; instead, logical data instills confidence in your decision-making process.
While data-based decisions may not always guarantee success, they enable your organization to focus on strategy without excessive worry about potential missteps.
Increasing Team Collaboration With A Common Language
Collected data now serves as a common language throughout your business. Any department can interpret real-time data and share their opinions to finalize the decision. As everyone is now on the same page, they can contribute to the final strategy, ensuring that it works best for your organization.
Setting Obtainable Goals And Save Cost
Businesses can set measure goals based on data – Source: Pxhere
While reviewing the data on past performance can suggest areas of improvement, analyzing newly collected data from market research equips your business with an overview of what to do next. The lack of data makes it challenging to determine where to spend more money and where to cut costs.
Therefore, your organization can set more measurable goals and outline the strategy to reach those targets, ultimately saving more cost. According to Harvard Business Reviews, introducing big data into the decision-making process can reduce expenses for businesses.
Improving Customer Retention And Employee Satisfaction
Gathering data from customer or employee surveys is instrumental in gaining a deeper understanding of both customers and employees. For customers, you can easily determine what makes them happy or dissatisfied to adjust your marketing plan and products accordingly.
In addition, employee satisfaction is the key to stable growth, so based on their feedback, you can make changes in the company policy or culture to enhance employee retention and engagement.
5 Steps To Apply Data-Driven Decision Making
Setting Clear Goals And Objectives
A clear objective serves as the compass for your strategy. Therefore, the first and foremost step is to understand your vision and establish measurable goals. We recommend initiating a kickoff meeting for a thorough discussion among the entire team. Determine the target audience and goals by analyzing yearly objectives, KPIs, and so forth.
Designing The Survey
In this fast-paced world, only a few customers are willing to complete your survey, so it’s best to keep it short and sweet with engaging questions. The ideal survey time is about 10 to 15 minutes, and you should avoid using the same format for all questions, as this could lead respondents to exit midway.
Another crucial aspect to focus on is data sources. Metrics such as gross profit margin, productivity, ROI (return on investment), recurring revenue, or the total number of customers can provide valuable insights. Utilize reporting tools as a reference to track the progress of your work.

Design a concise and engaging survey – Source: Pxhere
Collecting Data
After finishing the design of your survey and determining the measured metrics, it’s time to program it on an online platform easily accessible to your target audience. The more responses you receive, the more data you can collect, enabling you to gain more accurate insights about the customer base. This phase typically takes about two weeks or more.
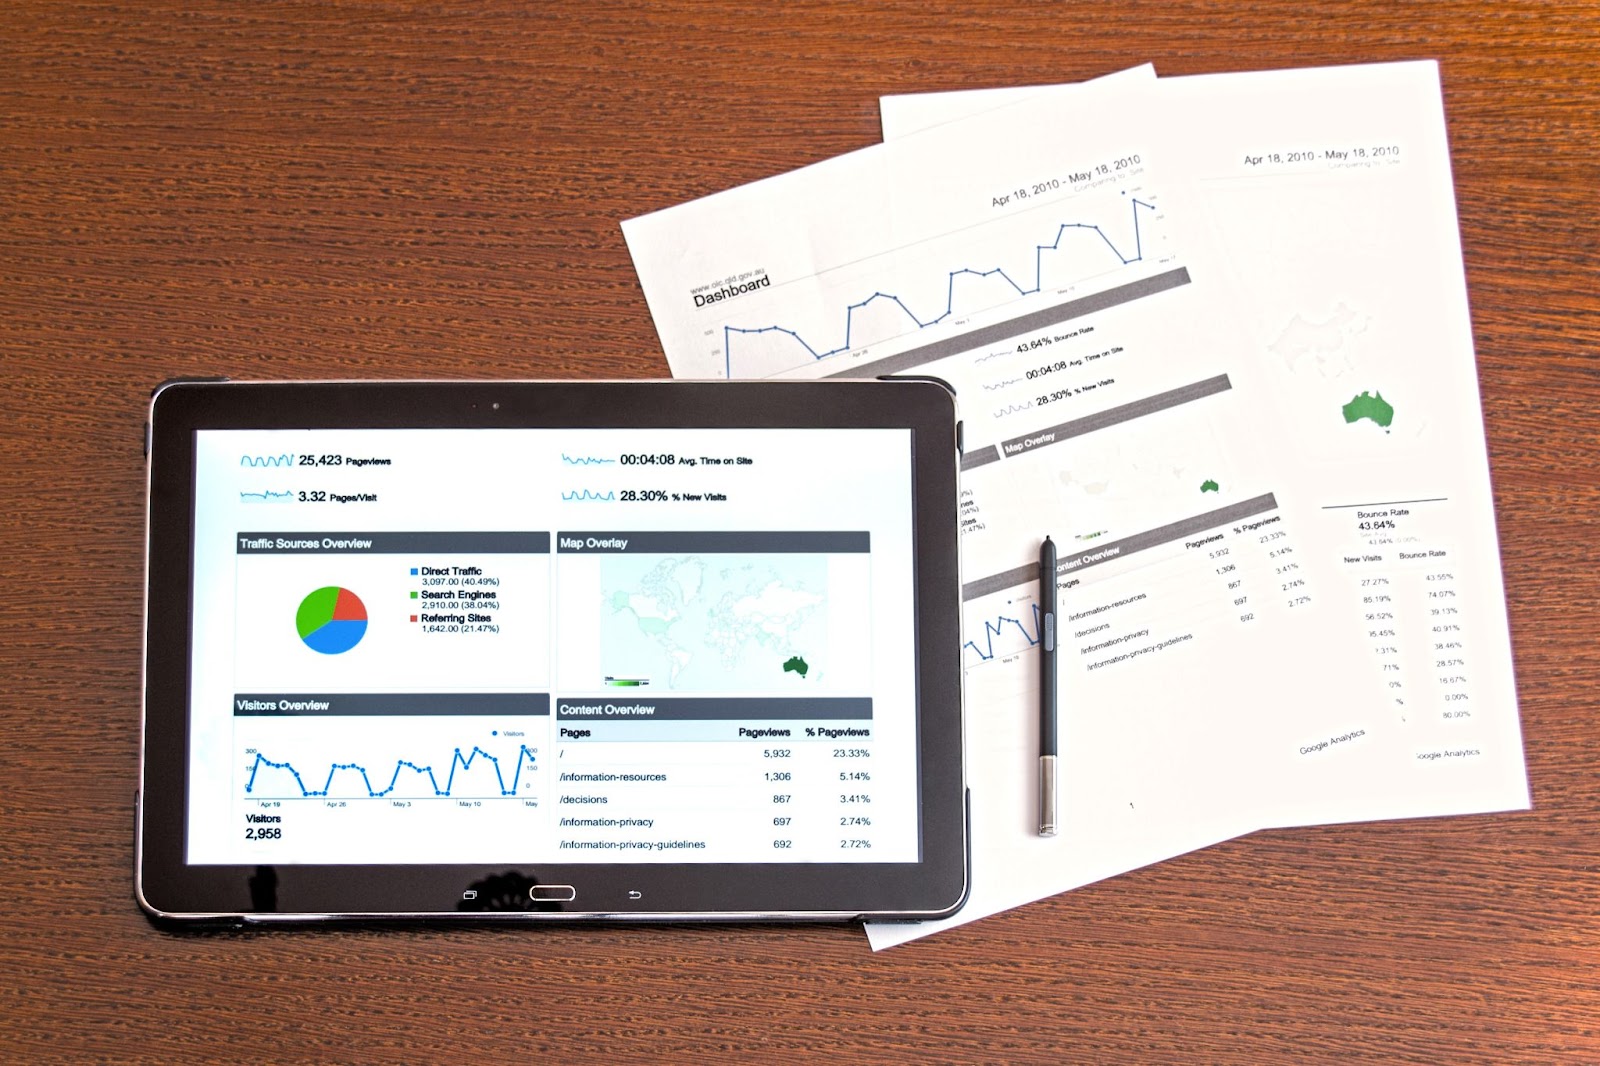
Organizing And Analyzing The Data
As data is gathered from various customers, organizing it is essential for enhancing data visualization. This approach allows you to easily discern the connections and reflections within relevant data. An executive dashboard serves as a handy tool to filter and display the highest-quality data, assisting your business in achieving its goals.
After placing the data in a well-organized structure, the next step is to interpret it to extract valuable insights and inform further actions. Data analytics enables you to identify areas of improvement. We recommend gaining various perspectives by sharing the data with the entire team.
Drawing Conclusion And Reporting
Based on the actionable insights you’ve gained, draw conclusions and share the report with your team. To arrive at a conclusion, ask yourself these questions:
- What information do I already know from the dataset?
- What is new from the dataset?
- How do I use these insights to achieve my business goals?
Then, create a market research report to streamline your decision-making process.

Draw conclusions based on your findings and create a report – Source: Pxhere
3 Data-Driven Decision Making Examples
Lufthansa Group
Lufthansa, one of the largest European airline companies with over 500 subsidiaries, has experienced a 30% efficiency boost by applying the DDDM approach, as reported by Tableau. This has resulted in uniformity in analytics reporting across its subsidiary network. By fostering a data culture within the company, Lufthansa has empowered its employees and achieved its objectives more efficiently.
The leadership and management at Google are widely regarded as second to none, largely attributed to the exploitation of data-driven decision making. Recognizing the impact of good managers on both revenue and employee retention, Google’s data analysts delved into employee surveys and performance reviews to discern the attributes that define effective management and those that don’t.
Their data analysis revealed a substantial gap between the least and most effective managers in terms of team productivity, employee turnover, and employee satisfaction. As a result, Google identified the top 8 traits of a great manager and the top 3 behaviors that characterize an ineffective one, assisting them in revising and changing their training program.
Amazon
Amazon is renowned for its recommendation engine, which suggests products aligned with customers’ intent. Through the analysis of past purchases, behaviors, and search patterns, Amazon recommends items tailored to what customers may need for their next purchases. The outcome has been more than stellar, with 35% of customers making purchases based on Amazon’s recommendations in 2017.
How Can You Use DDDM In Different Departments?
HR
An HR department, often juggling multiple projects under tight schedules, can gain visibility into the hiring process and turnover by leveraging big data, thereby streamlining the team’s workflow. By delving into employee satisfaction, engagement, and development, HR managers can understand how to connect their personnel and collectively enhance outcomes for the business. Some ways DDDM can benefit the HR department include:
- Eliminate manual calculations
- Identify talent trends quickly based on the dataset
- Make personnel predictions, like those who tend to quit their jobs, to take proactive actions and minimize their impact.
Finance

DDDM benefits your finance department a lot – Source: Pxhere
A comprehensive data analysis provides a better understanding of the company’s current financial status, allowing analysts to forecast financial health and adjust their strategy accordingly. By integrating data from various sources, companies can compare actual costs with allocated budgets. Additionally, leveraging past data enables businesses to identify potential risks and assess their likelihood. All the calculations now are data-based and run automatically, eliminating missteps and saving time.
Do’s And Don’ts In The Data-Driven Decision Making Process
Do’s
- Pay attention to data patterns everywhere, extract their insights, and draw conclusions. Try to ask why they exist to understand their story.
- Whether it’s a business-related or personal issue, don’t rely on your intuition, bias, or past behavior. Instead, look at the available data to inform your decision.
- Visualizing your data, like drawing graphs, to interpret the information more quickly.
Don’ts
- Choose poor-quality data that doesn’t fit your decision making or planning process.
- Overly rely on past experiences in your business. This approach will do more harm than good. The market is constantly evolving, and there is a good chance of missing current trends if you only look back. Instead, establish a sweet spot between past experiences and newly collected data.
- Make decisions based on confirmation or optimism bias.
- Fail to set clear, measurable goals. You can’t define what data works wonders for your business in the vast pool of information.
- Ineffectively communicate the data to customers. If customers can’t understand your findings correctly, your goals are still far away.
Conclusion
While data-driven decision making has become a mainstream approach, proving its effectiveness in most businesses, not every organization knows how to apply it properly. We hope our guide can assist you in making the most out of DDDM and boosting your business growth.

More From Blog
March 13, 2026
BFSI: Modernizing Core Banking Systems Without Disrupting Operations
Digital banking appears sophisticated on the surface. Customers transfer money in seconds, open accounts remotely, and receive real-time notifications. Yet beneath these seamless experiences, many banks still operate on infrastructure designed decades ago. According to Boston Consulting Group’s June 2025 report, between 90 and 95 percent of banks in the Southeast Asia region still operate […]

October 28, 2025
Australia’s Fintech Revolution: Trends Shaping the Future of Digital Finance
Australia has emerged as one of the most dynamic fintech hubs in the Asia-Pacific region, driven by strong consumer demand for digital financial services, supportive government regulations, and the widespread adoption of innovative technologies. As the industry matures, the imperative for digital transformation has become unmistakable: fintechs and financial institutions alike are under pressure to […]
August 12, 2025
AI and Big Data in Building Smart Insurance Platforms
The insurance industry is now standing at a pivotal moment in its digital evolution. Traditional insurance models built on historical data analysis and reactive risk assessment are rapidly giving way to intelligent, predictive platforms powered by artificial intelligence and big data analytics. This transformation represents more than technological modernization; it’s a fundamental reimagining of how […]
July 23, 2025
Insurtech’s Game-Changing Trends: How AI and Digital Transformation Are Reshaping Insurance
The financial technology sector is experiencing unprecedented change, making it essential for business leaders and technology professionals to stay ahead of emerging innovations. Throughout 2025, insurance technology (insurtech) has emerged as a powerful catalyst for change, fundamentally altering how insurance providers conduct business, engage with clients, and assess risks. This technological evolution represents more than […]
April 4, 2024
Big Data Performance: Maximize Your Business Value
In today’s data-driven world, organizations are constantly generating and collecting immense amounts of data to understand their customers more deeply. This data, often referred to as “big data,” holds immense potential for organizations to seek opportunities and overcome challenges. But accessing and analyzing big data isn’t enough to have proper strategies; organizations must pay attention to […]
April 4, 2024
How Real-Time Data Analysis Empowers Your Business
In today’s fast-paced business landscape, the ability to quickly make data-driven decisions has become a key differentiator for success. Real-time data analysis, the process of analyzing data as soon as it’s generated, has emerged as a powerful tool to empower business across industries. By leveraging real-time data analysis, organizations can gain timely and actionable insights, […]